PinLab - Pinterest Analytics Dashboard
Turning Pinterest analytics into creative decisions.

01. Project Overview
As an active Pinterest creator, I wanted to understand why certain posts performed better than others and use those insights to make more intentional creative decisions.
Pinterest provides performance metrics, but connecting those numbers to content characteristics, tracking results over time, and documenting experiments required a more structured workflow.
I created PinLab, a personal analytics studio that brings performance data, creative metadata, and content experiments into one place.
02. The Problem
03. From Concept to MVP
THE PROJECT
Role: Independent product creator
Tools: Lovable, Pinterest Analytics, CSV data
Status: Functional MVP · Ongoing personal project
Focus: Product discovery, UX design, data modeling, analytics, experimentation
I had the numbers. I didn't have a system for learning from them.
Pinterest could tell me how many impressions or saves my content received, but I wanted to answer more specific questions: Which themes consistently attract attention? Which formats are worth testing? What can I learn from a post that outperforms the others?
The challenge became more apparent when I started working with real Pinterest exports. Account-level trends, board-level performance, and pin-level results were provided at different levels of detail. Some exports contained daily metrics but no pin information; others contained pin impressions without the creative attributes I wanted to analyze.
I needed a way to bring those different sources together without treating missing information as zero or combining metrics that weren't directly comparable.
Designing for a creator, not an analytics department.
My initial prototype included familiar dashboard components: performance metrics, charts, top-performing pins, and an experiments tracker. It was functional, but its presentation felt more like a conventional business analytics tool than something designed around visual content.
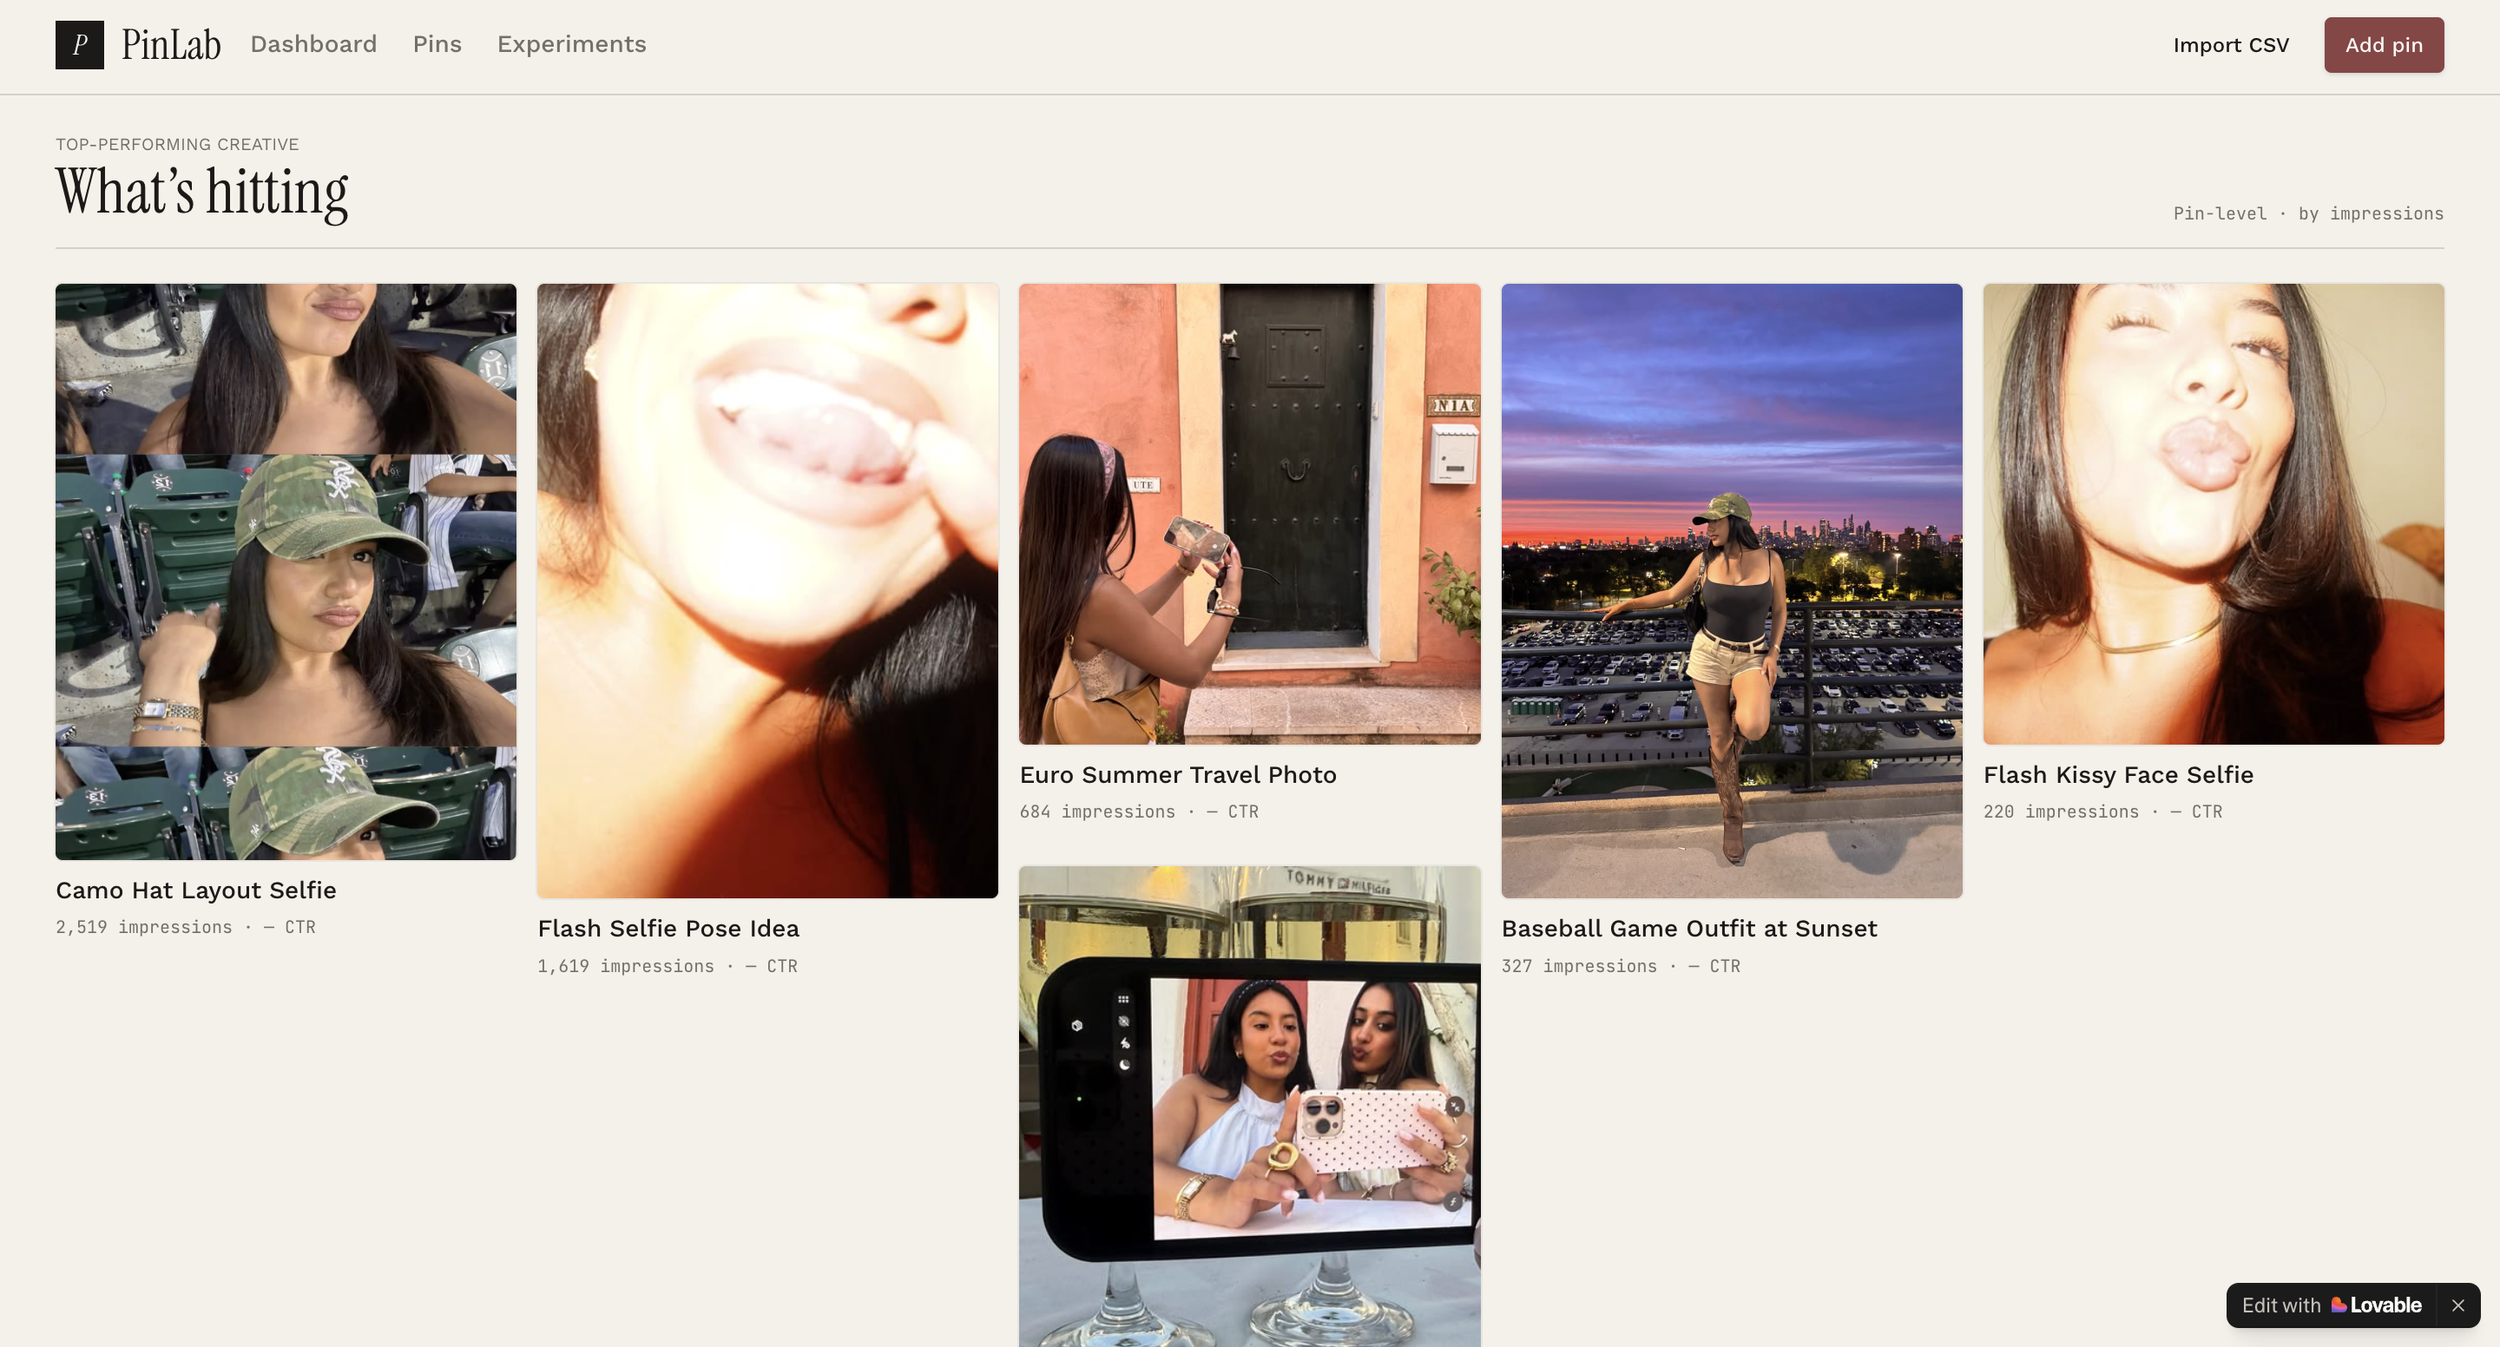
I revisited the information hierarchy using my own Pinterest activity as a reference. I shifted the experience toward an editorial, image-first interface while keeping performance data easy to scan.
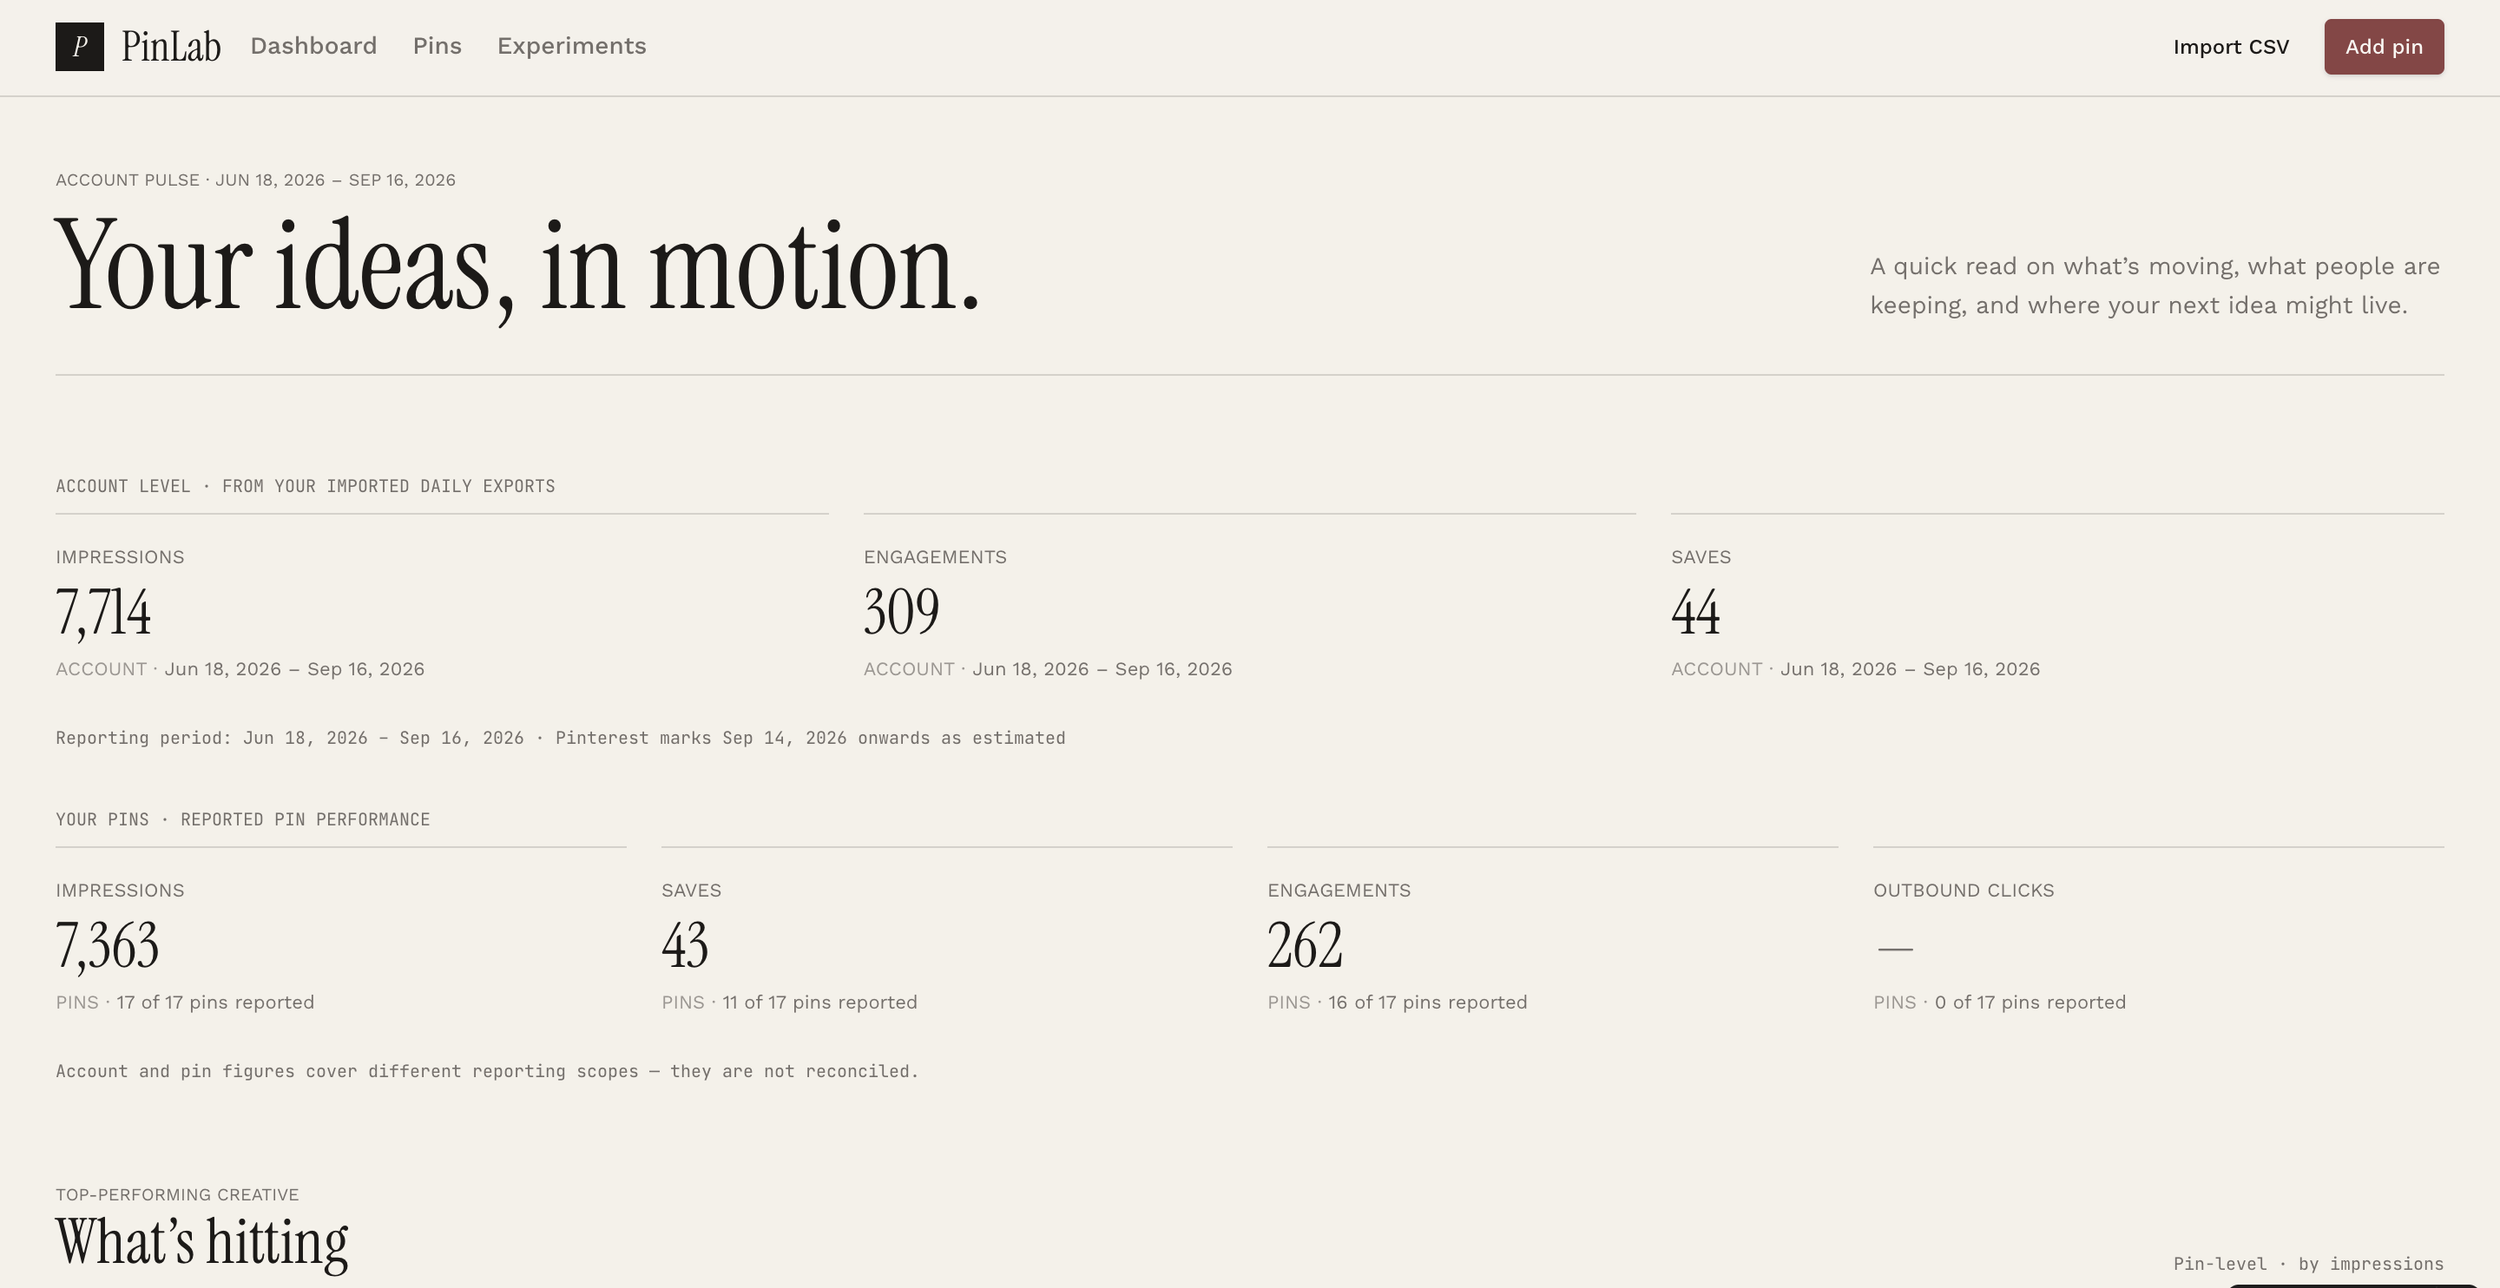
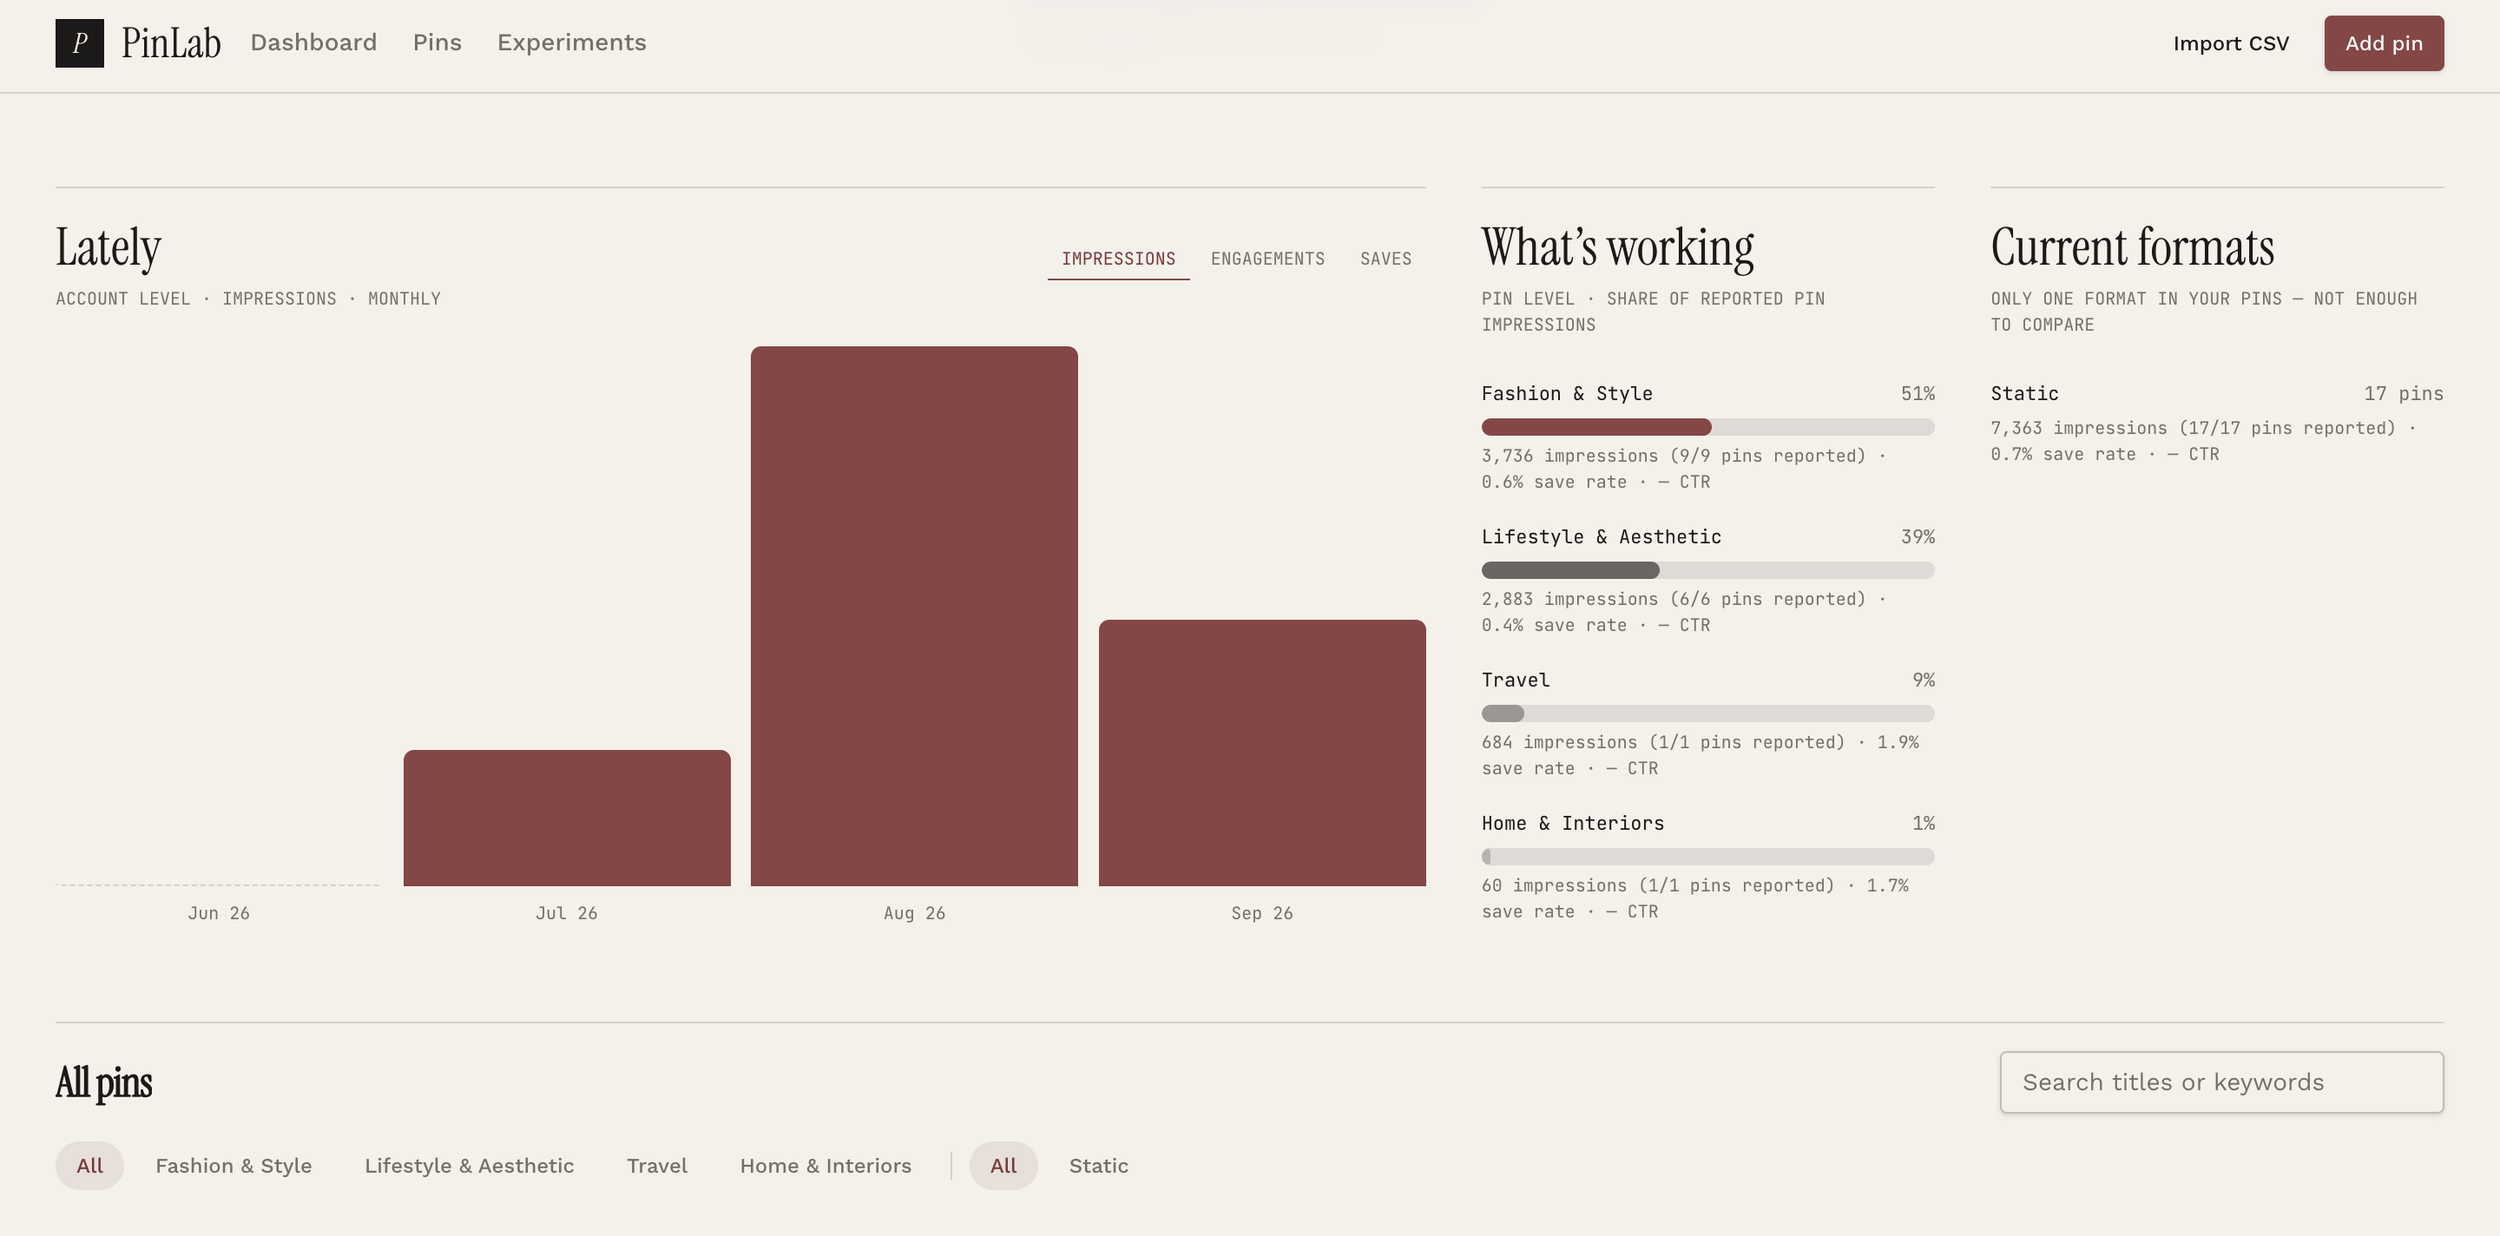
Baseline analytics - A focused overview of account trends and reported pin performance.
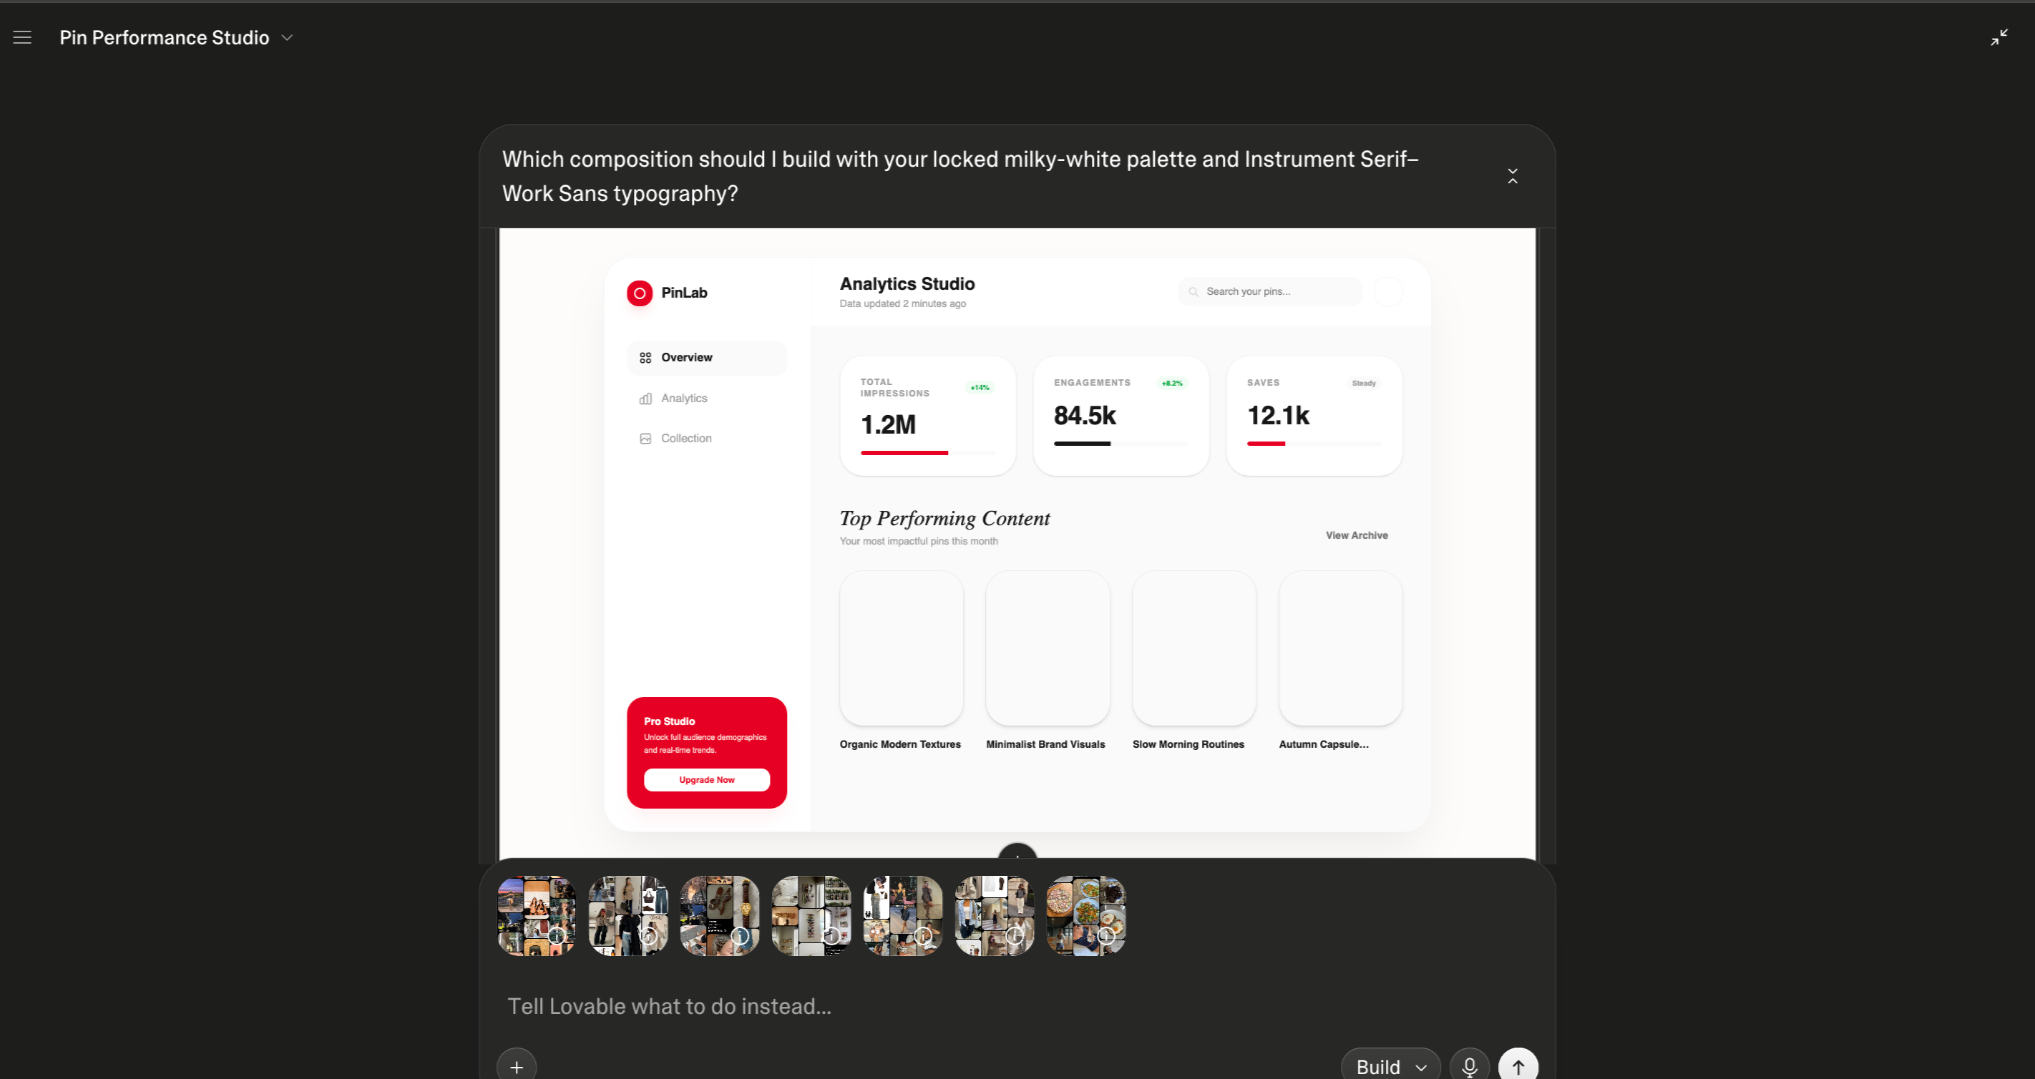
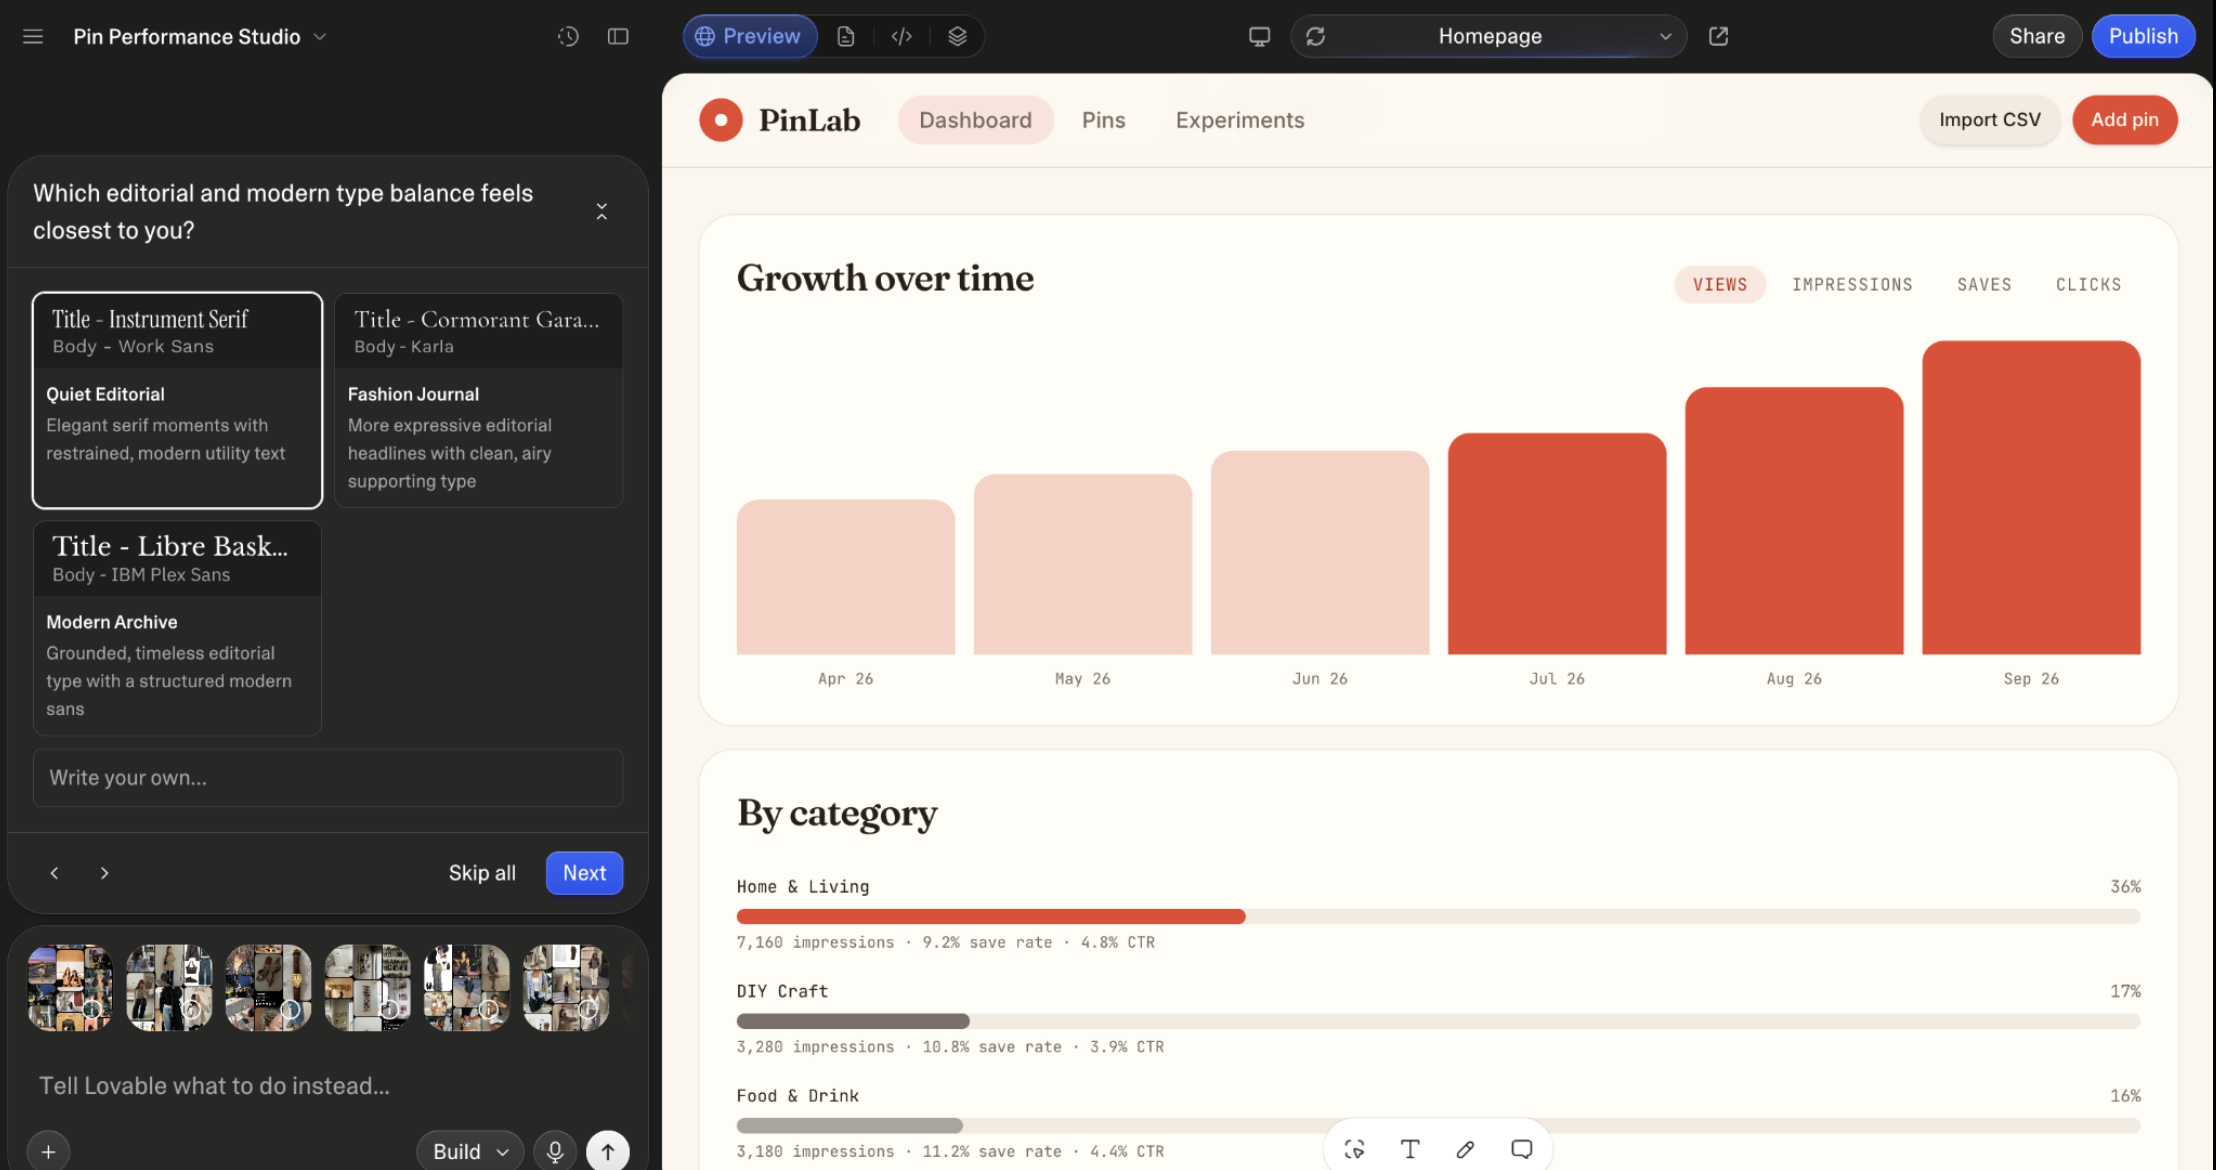
At this point in my project, I cared mostly about functionality and fleshing out these ideas. Afterward, I used editorial typography and restrained colors to give the product a personal creative identity; prioritized pin imagery alongside performance metrics; and organized the dashboard around three recurring questions: What's growing? What's hitting? What's working?
04. The turning point: testing with real data
05. The resulting MVP
06. What’s next for PinLab?
The first real import changed the product requirements.
The initial MVP was built around an assumed data structure. Once I imported my actual Pinterest Analytics exports, I found that the available data did not map neatly to the dashboard.
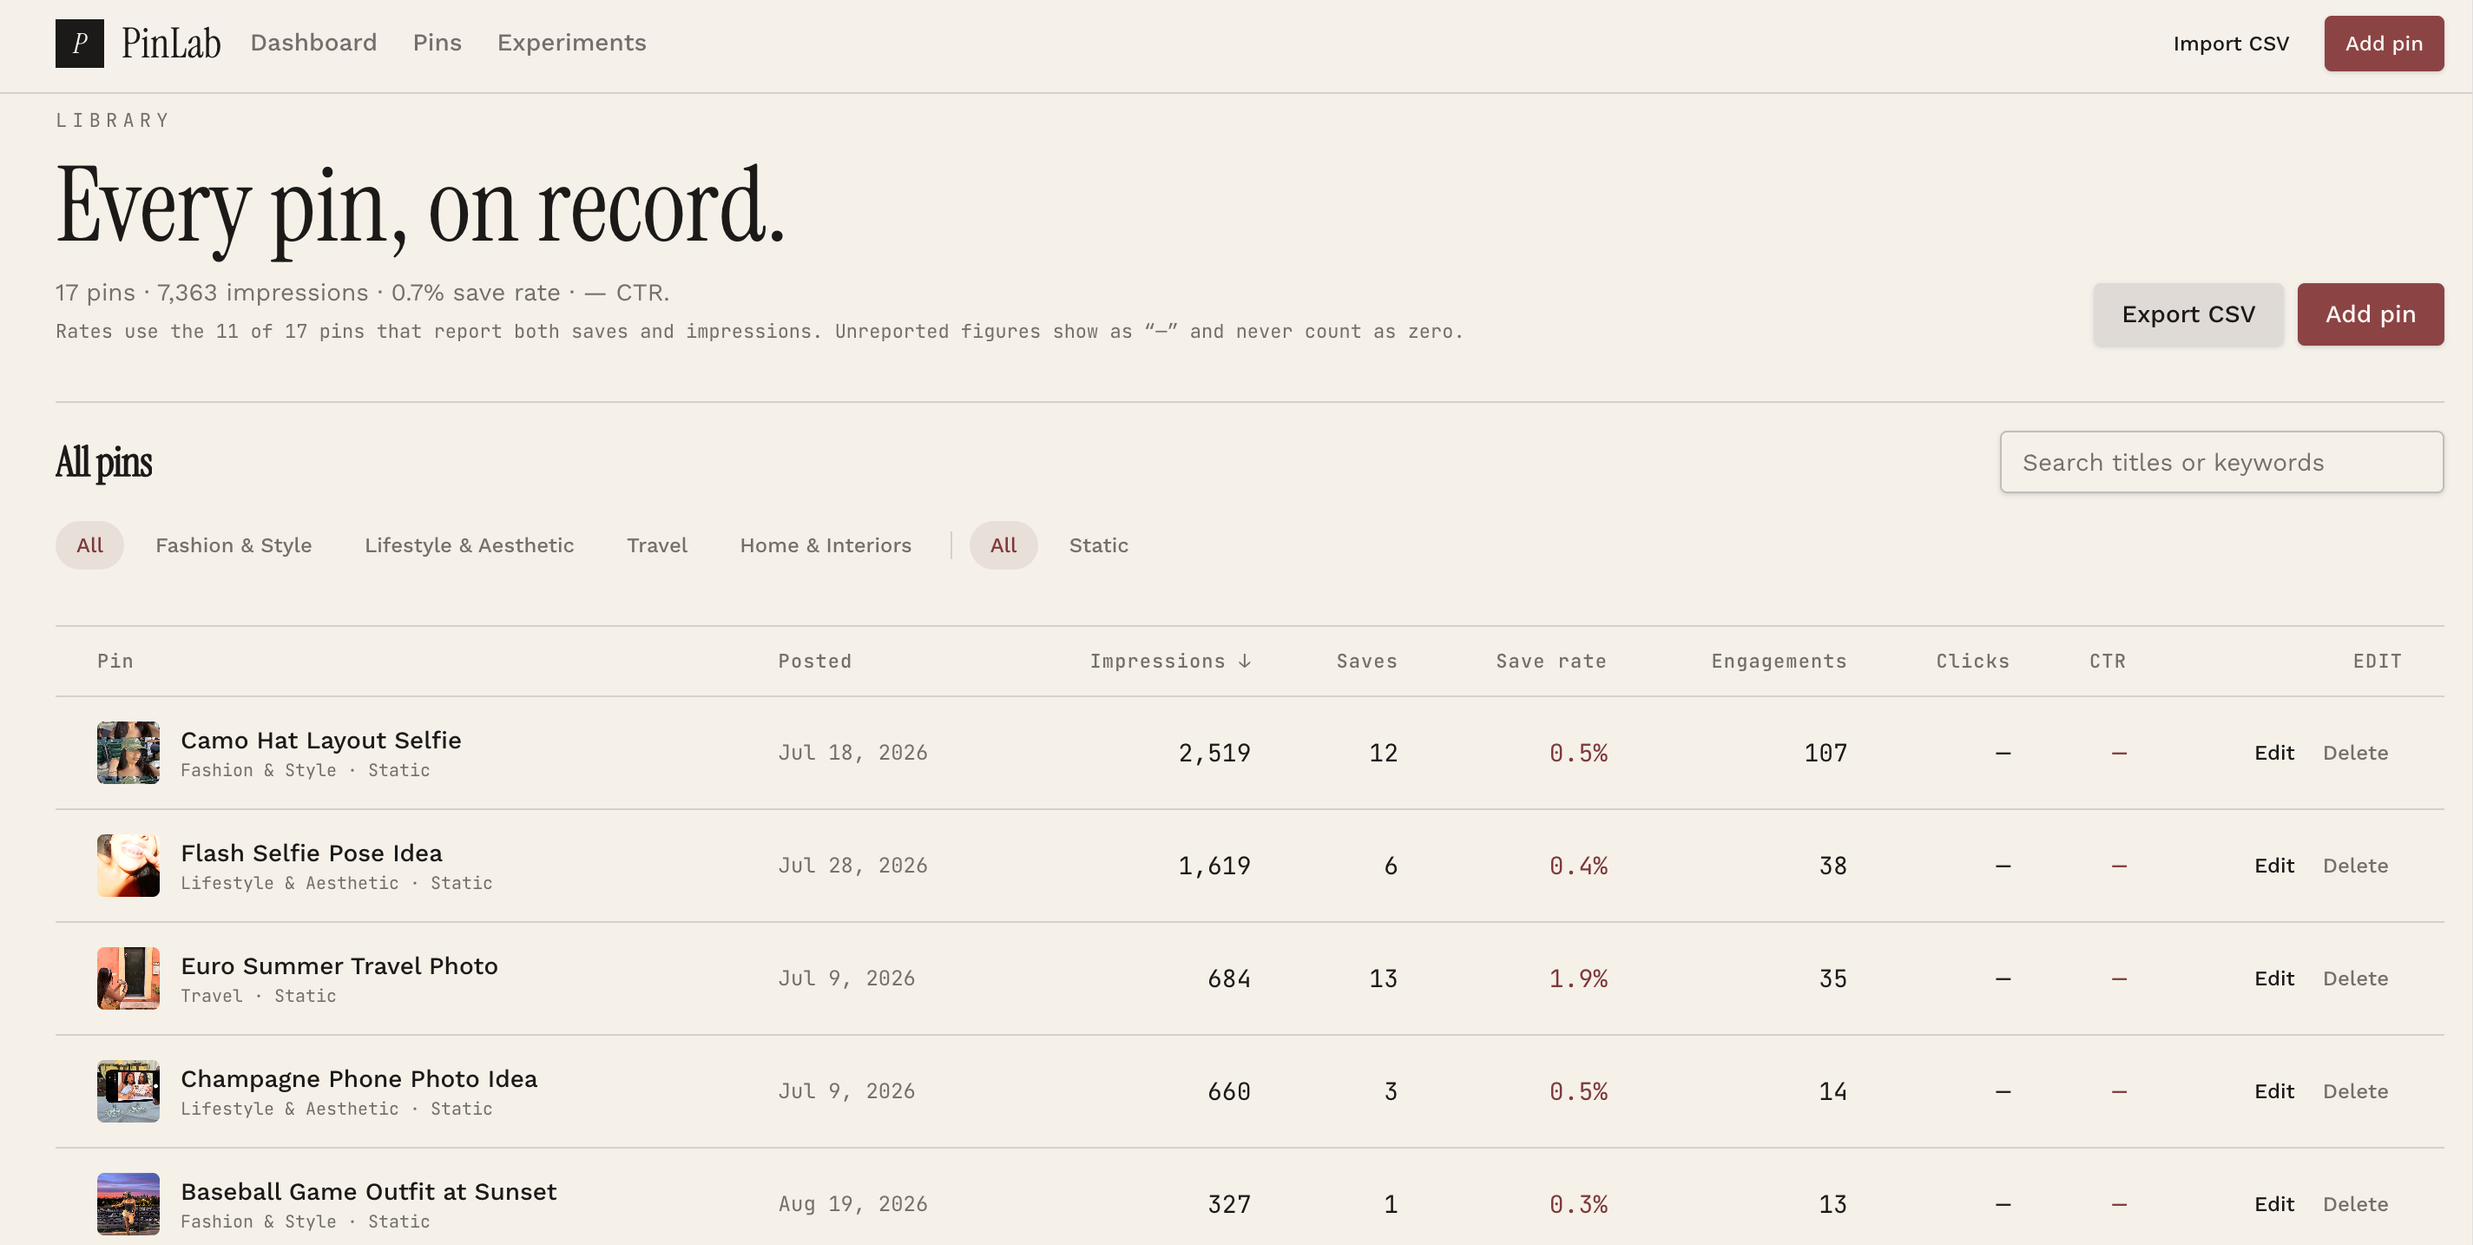
My exports contained daily account metrics, board-level results, and pin-level impressions, but it did not consistently include per-pin saves, engagements, outbound clicks, or creative metadata.
That exposed a product risk: displaying unavailable values as zero, or combining metrics from different reporting levels, could produce misleading conclusions about content performance.
How the product evolved
Recognize real Pinterest exports
Added support for importing Pinterest's multi-section CSV files rather than requiring every file to match PinLab's original template. This included CSV tables with account level pins along with account level metrics for the following files: saves, engagements, and impressions.
Preserve reporting context
Kept account-level and pin-level metrics separate, with reporting periods and coverage indicators.
Represent missing data accurately
Unavailable metrics display as unknown rather than zero and are excluded from calculations that require them.
Support repeated imports
Used stable pin identities and reporting-period snapshots so newer exports can update existing records without creating duplicate pins.
Improve the import experience
Tested the actual import flow and identified that daily-metric files could appear to contain no useful data because the preview emphasized pin counts. The workflow now supports importing those files into the dashboard.
A working analytics workflow built around my own content.
PinLab now combines imported Pinterest performance data with manually maintained creative metadata, allowing me to review account trends, inspect individual pins, compare content categories, and document experiments.
The website to my current project is https://pin-lab-studio.lovable.app/. Feel free to visit and include your Pinterest analytics, or test out the product with my CSVs.
A useful analytics product needs trustworthy data before it needs more features.
Building PinLab taught me that the most consequential product decisions were not always visual. Working with real exports forced me to consider data availability, reporting scope, missing values, duplicate records, and the clarity of the import experience.
I have made the baseline of ensuring the analytics are accurate, but now I want to test out some cool features and themes on my Pinterest profile and compare growth!
My next step is to use PinLab consistently with my own content: complete the creative metadata for my pins, identify a testable content hypothesis, document an experiment, and evaluate its results using the available metrics. I have also requested its API, so please come back for updates as more fun stuff is on the way!